Gemini WebSocket Terminal
A command-line feed handler that connects to the Gemini exchange, subscribes to instruments on the v2 market data feed, and maintains an in-memory order book per symbol. A producer thread reads frames off the TLS socket, parses them, and enqueues updates. A consumer thread dequeues, applies them to the book, and emits a latency sample. Every sample lands in a shared-memory ring that a separate process drains into Prometheus, so the hot path is measured rather than estimated.
It started as a way to work through TLS handshakes, lock-free SPSC queues, and
the differences between mutex, atomic load/store and wait-free coordination on
a critical path. More recently I have been using it to learn where the time
actually goes, with perf, strace and a Grafana dashboard, and to fix what
those tools turn up.
See it running
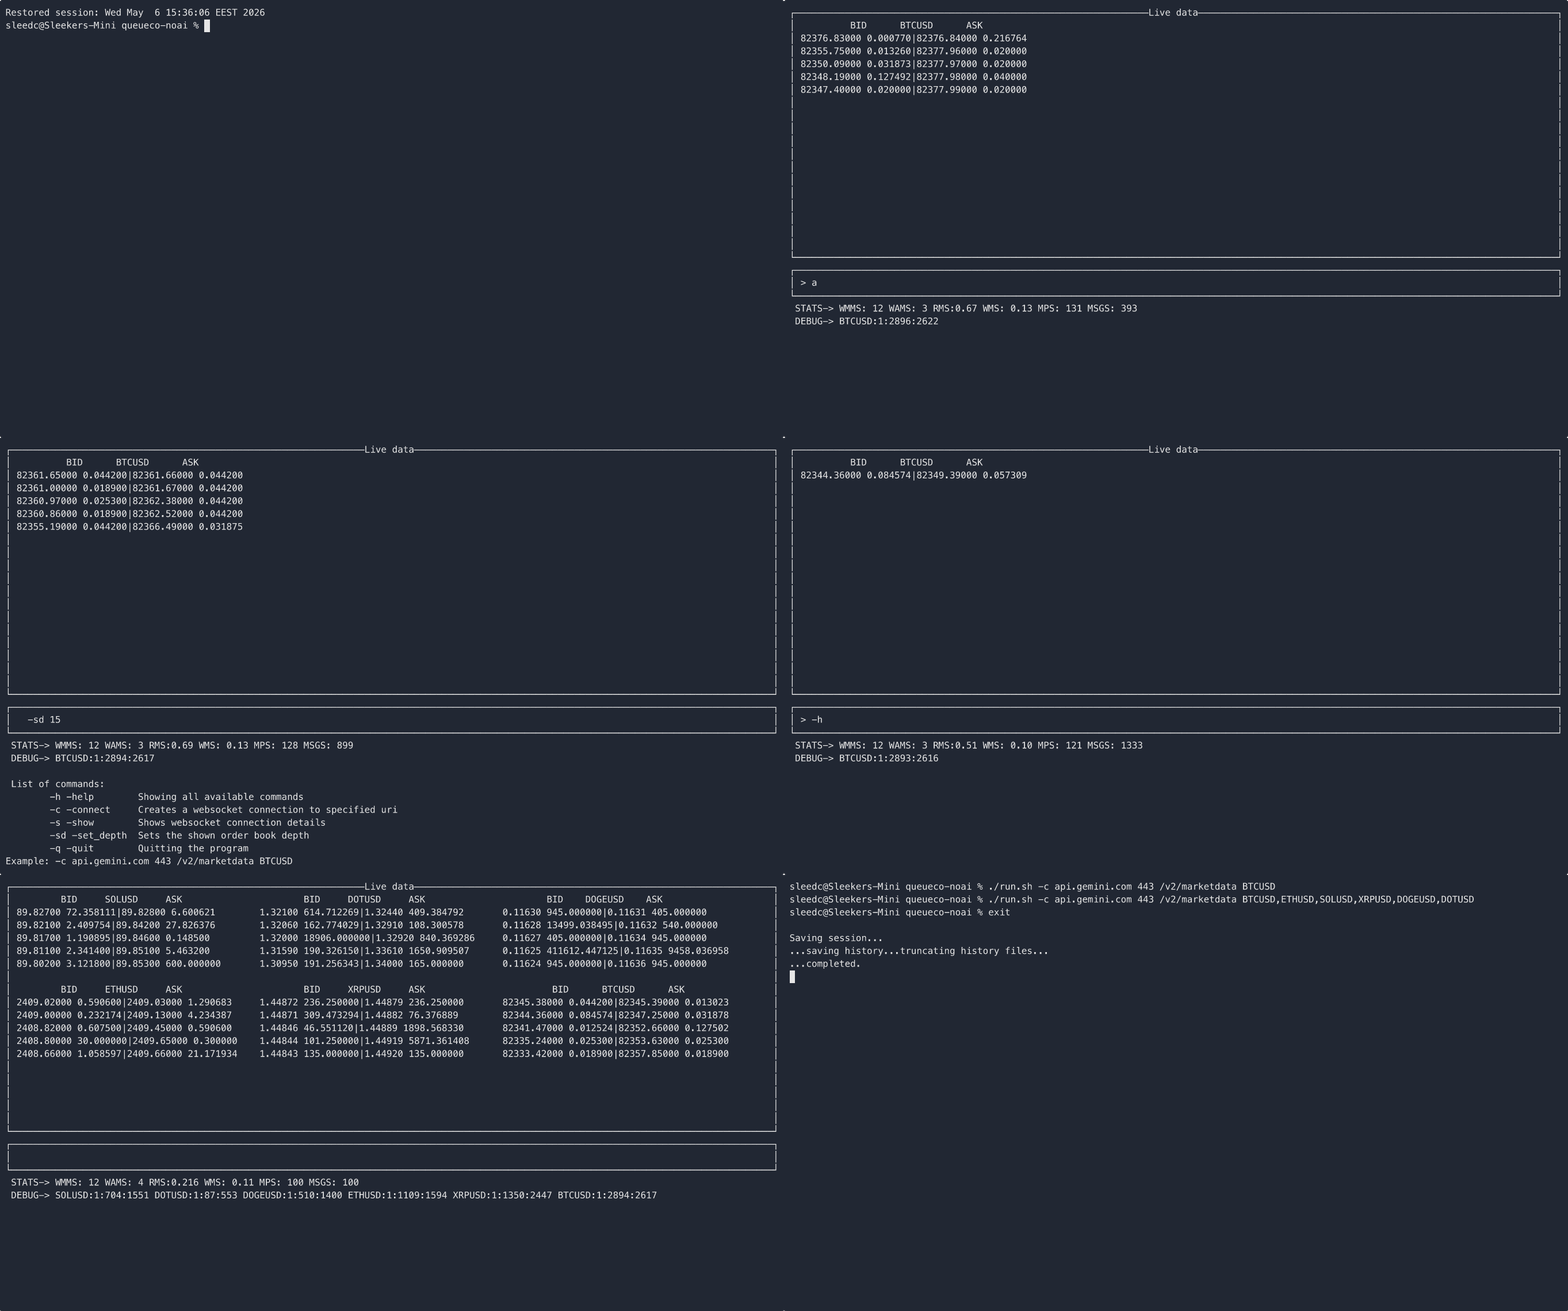
The ncurses display is a compile-time option and is switched off in the default
build (DISABLE_NCURSES). With it off the process runs three threads and no
rendering work runs on the message path.
Architecture
Three threads, each pinned to its own core on Linux:
- app holds the process open and parks in
join()for its lifetime - producer does
recvfromon the TLS socket, parses the JSON, and enqueues - consumer dequeues from the SPSC ring, applies to the book, and pushes a latency sample
The producer and consumer communicate through a single-producer
single-consumer queue with a std::mutex and std::condition_variable pair
for signalling. Head and tail indices are alignas(CACHE_LINE_SYS_SIZE) so the
two sides never share a cache line, with the line size selected per
architecture at compile time.
The socket read is blocking rather than poll or epoll driven. read() on the
Beast stream parks the thread until a frame arrives, so a connection needs a
thread of its own. Adding a second venue means adding a thread rather than
registering another descriptor with an event loop, and that shapes what
multi-venue support would cost here.
Three concurrency strategies, selectable at compile time
//#define ENABLE_MUTEX
//#define ENABLE_ATOMIC_LOADSTORE
#define ENABLE_ATOMIC_WAITFREE
Each sits at a different point between simplicity, correctness guarantees, and producer-side cost.
The mutex variant is the baseline. It is easy to reason about and the contention window is short. It takes and releases a lock on every L2 update.
The atomic load/store variant uses std::atomic<std::shared_ptr<OrderBook>>
so the producer publishes a fresh book pointer after each update and the
consumer loads it without locking. It works, but it requires a full copy of the
book on every update, because the producer cannot mutate in place while the
consumer might be reading.
The wait-free variant is the default. The producer enqueues into a ring and never blocks. The consumer dequeues and applies. With exactly one writer and one reader, neither side waits for the other, and the producer’s only job per update is to append. All the bookkeeping is paid by the consumer.
Across six instruments the app’s own timers put producer time at roughly sub
0.12 ms for the wait-free queue, close to 1 ms for atomic load/store with its
full book copy, and up to 0.4 ms for lock_guard. Those are ad-hoc in-app
numbers rather than the measured pipeline below, and they are why the wait-free
variant became the default.
The order book
The default build keeps bids and asks as sorted flat vectors of price and
quantity pairs, located with std::lower_bound and mutated with insert and
erase. Map-based and iterator-cache variants are still in the tree behind
MAP_BASED_ORDERBOOK and ITERATOR_BASED_ORDERBOOK.
Profiling settled a question I had guessed at. Across the consumer’s cycles,
the pair<double,double> copy and move work totals about 1.5% while both
lower_bound instantiations together total about 0.06%. That is roughly 25
times more cycles in the shift than in the search, which is what a sorted flat
vector should look like: the search is eight comparisons in L1, and the insert
or erase moves every element past the insertion point. Shift cost scales with
how many levels sit past the insertion point rather than with book depth as a
whole. Both the insert and erase paths carry comparable weight, which confirms
zero-quantity updates are being handled as removals rather than stored.
Measuring it
The consumer writes one sample per message into a shared-memory ring:
uint64_t applyNS = Helper::now_ns();
g_latencyRing.push(seq++, queueData.mRecvNS, queueData.mParseNS, applyNS);
The transport is an atomic SPSC ring in POSIX shared memory with a monotonic 64-bit write index, power-of-two capacity with mask indexing, a release store on publish and an acquire load on the reader. It overwrites rather than blocks. The writer advances unconditionally and never checks the reader’s position, so a stalled reader can never stall the feed handler. The reader detects having been lapped by comparing the write index against its own position before each drain.
The reader is a Python process that attaches read-only, drains every 200 ms,
and exposes the samples as Prometheus histograms over HTTP on one port, using a
feedhandler label to distinguish feed handlers rather than a port or metric
name per handler. Prometheus scrapes it and Grafana queries Prometheus. Two
histograms: feedhandler_recv_to_apply_us and feedhandler_parse_us.
Each stage can fail without taking the others with it. The exporter can crash, be restarted or be upgraded without touching the feed handler process, and Python stays entirely outside the measured process. Prometheus and Grafana run on a different machine again, so scraping and dashboard rendering do not take cycles from the thing being measured. The scrape interval is one second. That is short for infrastructure monitoring, but latency on this path moves on a timescale that a fifteen or sixty second scrape smears away.
The dashboard is four panels. Percentiles over time, a bucket heatmap that
makes multi-modal behaviour visible where percentile lines hide it, throughput,
and a bucket-coverage check that catches samples piling into +Inf instead of
landing in real buckets. The exporter also publishes the timestamp of the last
sample it actually read, which distinguishes “the exporter is answering
scrapes” from “the feed handler behind it is still producing”. That works as a
query. It is not wired up as a live alert rule, so a stale dashboard still has
to be noticed by eye.
The observability stack around this project, meaning the shared-memory transport, the Python exporter, and the Prometheus and Grafana deployment, was designed and debugged with the assistance of an AI agent across several sessions. It is instrumentation rather than the object of the work. The feed handler itself, and everything measured, interpreted and concluded below, is my own.
The first bucket ladder taught me something about reading my own dashboard. It
used a 1-2-5 progression (50, 100, 200, 500) and about 80% of observations
landed in the single 100 to 200 µs bucket, so histogram_quantile() reported
p99 as a flat 200 µs. That was the bucket boundary, not a measurement. The
current ladder places around six boundaries across the observed range.
Two defects the syscall trace found
A 10 second strace -c on the running process, at six instruments:
% time     seconds  usecs/call     calls    errors syscall
------ ----------- ----------- --------- --------- ----------------
 49.10    0.115091         186       617           clock_nanosleep
 41.61    0.097522          98       993           recvfrom
  9.29    0.021779           6      3399       331 futex
617 clock_nanosleep calls in 10 seconds with no corresponding work, and 331
futex errors, 10% of all futex calls. Two separate causes.
A polling loop with no consumer. The main thread ran
sleep_for(16ms) in a loop purely to stop main() returning. That is 62
wakeups a second, roughly 3,700 context switches a minute for nothing, on the
same core the producer was running on at the time. It also used CLOCK_REALTIME and drifted, with successive returns
measuring 0.016079, 0.016091, 0.016101 and 0.016114 seconds. Replacing it with
marketDataProducer.join() means the thread parks on one futex with a NULL
timeout for the process lifetime. The main thread now appears exactly once in a
full trace.
A condition variable without a predicate. The consumer called
wait_for(lock, 20ms), which returns on notification, on timeout, or
spuriously, with no way to tell which. condition_variable is stateless, so a
notify_one() with no thread waiting wakes nobody and is not remembered. With
a spin phase running before the wait, that window is wide enough to lose
notifications regularly. The trace shows it plainly across eight consecutive
iterations:
futex(0xfffff0876050, FUTEX_WAKE_PRIVATE, 1) = 0 <0.000013>
futex(0xfffff08760a4, FUTEX_WAIT_BITSET_PRIVATE, 68209, {...}) = -1 ETIMEDOUT <0.020037>
futex(0xfffff0876050, FUTEX_WAKE_PRIVATE, 1) = 0 <0.000016>
futex(0xfffff08760a4, FUTEX_WAIT_BITSET_PRIVATE, 68209, {...}) = -1 ETIMEDOUT <0.020076>
FUTEX_WAKE returns the count of threads woken. Zero, every time. The expected
value stays frozen at 68209 across all four waits, and that integer is what
FUTEX_WAIT compares against inside the kernel, so no notification was sent
during those 80 ms. The consumer was timing out and finding items that had been
sitting in the queue the whole time.
The fix is a predicate:
mConsumerCv.wait(lock, [this] {
    return !mSPSCQueue.empty()
        || !mIsConsumerThreadRunning.load(std::memory_order_acquire);
});
The predicate is evaluated before sleeping, so an item that arrived during the
spin returns immediately and the lost-notification race closes. It is
re-evaluated on every wake, so spurious wakeups become harmless. The running
flag has to be in there as well: without it, removing the timeout hangs
shutdown permanently, because the queue is empty at shutdown and !empty()
alone can never become true. The 20 ms timeout was removed entirely.
Ahead of the wait sits a bounded spin phase that checks the clock every 512
iterations rather than on every dequeue attempt, since steady_clock::now() is
a vDSO call at around 20 ns and calling it per attempt would be a meaningful
fraction of the spin’s own cost.
Result
After the change the steady-state cycle is one recvfrom, one FUTEX_WAKE
returning 1, and one untimed FUTEX_WAIT, per message. The expected value
increments monotonically instead of sitting frozen. Producer to consumer
handoff measures 22 µs across the two trace timestamps.
Batched receives show up as recvfrom with no following futex at all, which is
the spin phase doing its job.
| before | after | |
|---|---|---|
| instruments | 6 | 239 |
| message rate | ~150/s | ~2,000/s, peak 3,200/s |
| p50 | ~140 µs | ~75 µs |
| p99 | 200 µs (bucket edge) | ~148 µs |
| p99.9 | 250 to 350 µs | ~200 µs |
| main thread context switches | growing, ~62/s | static at 7 voluntary, 9 nonvoluntary |
Two things move those numbers and this data cannot fully separate them. One is the fix. The other is cache warming: at 2,000 msg/s the mean gap between messages is around 500 µs rather than 10 ms, so caches, branch predictors and TLB stay warm. Separating them would have needed the message rate held constant across the change, which is not what I did.
Measuring the second effect on its own, at [1m] resolution across three rate
cycles, gives around 20 µs p50 at 3,600 msg/s against around 50 µs at 1,000
msg/s. Higher rate produces lower latency, which rules out queueing. The
consumer only blocks when the gap to the next message exceeds the spin budget,
so the percentile at which that budget sits in the inter-arrival distribution
is the fraction of messages that avoid a wakeup, and the sleep rate roughly
doubles at the trough. There is consequently no single baseline latency figure
for this system. Any number has to state the message rate it was taken at.
At [10m] the latency dip appeared to trail the rate spike by a minute or two.
At [1m] it is simultaneous. The lag was the rate window smearing a short
burst of fast samples forward. Two earlier before-and-after comparisons in this
project were invalidated by that.
CPU profiling
Apple Silicon under Asahi Linux exposes four PMU events: branches,
branch-misses, cycles and instructions. No cache-misses, no TLB counters, no
machine_clears, and no perf c2c, so cache behaviour and false sharing are
not measurable on this host and IPC-based inference has to substitute.
The measurements run under Linux rather than macOS because
sched_setaffinity is a placement guarantee, where macOS offers affinity hints
the scheduler can ignore. Pinning targets the performance cores.
Process-wide numbers mean little here without per-thread scoping, which was the
first finding. 86% of process cycles are the consumer’s spin loop, and a tight
loop polling one index is perfectly predicted and cache-resident, so a
process-wide IPC of 6.84 and a branch miss rate of 0.116% describe the spin
rather than the work. perf stat -t takes a TID and scopes properly.
perf stat -p takes a PID and silently resolves to the whole thread group.
Scoped per thread, at 239 instruments and around 2,000 msg/s:
| producer | consumer | |
|---|---|---|
| IPC | 2.93 | 7.49 |
| branch miss | 0.72% | 0.018% |
| instructions / 10 s | 3.7 B | 27.1 B |
| cycles / 10 s | 1.3 B | 3.6 B |
The producer at IPC 2.93 on an 8-wide core is stalled roughly two thirds of the
time on dependent loads, allocation and unpredictable branches. Categorising
the symbols that carry 92% of its samples: nlohmann JSON 34.0%, string and
char_traits work 16.4%, unclassified and largely JSON-adjacent 15.1%,
OpenSSL 8.7%, the lexer’s vector<char> token buffer 8.6%, Boost.Asio and
Beast 4.7%, allocator 4.7%. Folding in the string and vector work the lexer
drives, JSON parsing is 60 to 70% of producer cycles, and it is the largest
remaining cost in the pipeline.
What that cost is made of is visible in the hot symbols. scan_string
accumulates tokens with one vector<char>::emplace_back per character. The
_Rb_tree<std::string, basic_json> entries mean every key is heap allocated
and every insert is a tree traversal. assert_invariant shows up at 1.68%. The
net is a full DOM with heap-allocated string keys in a tree, built one
character at a time, for a message of roughly 110 bytes from which a handful of
fields are read.
One measured fix so far. The spin loop’s clock check ran every 100 iterations
and __kernel_clock_gettime was 3.2% of process cycles. CLOCK_CHECK_INTERVAL
controls only the granularity of the expiry check, not the budget itself, and
at around 0.6 ns per spin iteration an interval of 512 overshoots the budget by
at most 300 ns, which is 0.03% of a 1000 µs budget. Changing the constant to
512 took the vDSO call to 0.91%, a 3.5 times reduction with no change in p50.
Known gaps
- The exporter has no tearing guard. It unpacks four fields per slot while the
writer may be overwriting that slot, and the
seqfield is read and discarded. Wrap handling is a clamp before the read loop, which detects being lapped beforehand but not during. A torn sample produces an arbitrary latency value, so an anomalous dashboard reading currently has two possible causes that cannot be told apart. - Ring occupancy is not instrumented, so queueing can only be ruled in or out by inference.
parse_usis a combined measurement spanning TLS decrypt, JSON parse and ring push. The profile percentages cannot be converted to wall-clock microseconds without separate timestamps per stage.- Spin efficiency is unmeasured. No counter distinguishes a spin hit from a block hit, so the budget is tuned against the inter-arrival distribution rather than against observed outcomes.
- Mutex unlock still issues a syscall per message, a
pthread_mutex_unlockwith no queued waiter, now at 2,000/s rather than 150/s. - Consumer book code is measured only as a share of cycles, not in wall-clock terms, and only while the spin loop was active.
- No alert rules are live. The staleness query exists but nothing is watching it, so a stalled feed has to be spotted on the dashboard.
- The multi-tenant exporter path has never been run against a second feed handler.
Trade-offs and things deliberately scoped out
Single venue. The structure supports an LRU cache of connection endpoints for multi-venue work, but only the Gemini handshake and parsing are wired up. Another venue means a second parser, since every exchange has its own L2 update format, plus reconciling sequence-number semantics, snapshot delivery and heartbeat cadence.
Single producer, single consumer. The whole concurrency story rests on this. Subscribing across multiple connections in parallel would mean either MPSC queues per book or per-connection consumer threads.
The spin budget trades CPU for latency. With a 1000 µs budget the consumer avoids blocking on roughly 85 to 93% of messages depending on rate, and holds around 11% of a core continuously to do it.
A few things I had to debug along the way
Crossed books. Bids appearing above asks, because I was applying L2 updates without handling deletions. The Gemini feed signals price-level removal with quantity zero, documented under their balance updates section, which took some finding.
Segfaults in the atomic load/store variant. I was not copying the loaded
shared_ptr before dereferencing in the writer, so I was mutating a book
another thread might be reading. The deeper issue was that OrderBook was
non-copyable at the time because it held iterators into its own maps, so a copy
constructor that preserved cache integrity was needed. I dropped the lookup
cache for that variant instead.
Heartbeats counted as book updates. The producer treated every incoming frame as containing book data. Filtering heartbeats out at the parsing stage stabilised the atomic variant.
Reconnect leaving recv() in a bad state. Testing failover with tcpkill
against the live connection surfaced three distinct failure shapes: a clean
pipe drop, a drop reported late by the send path, and a drop during the
reconnect handshake itself. The Gemini hostname resolves to many addresses, so
a reconnect sometimes lands on the same address being dropped. Fixing it meant
sorting out duplicate connection entries, access to freed memory, and not
inflating the shared_ptr refcount when reading connection state.
mvwprintw format warnings on Linux. Passing a std::string’s c_str()
directly as the format argument is an arbitrary memory access waiting to
happen. mvwprintw(win, y, x, "%s", str.c_str()) everywhere fixed it.
The measurement pipeline then started finding its own class of bug, ones that produced plausible output rather than a crash.
Every sample in the +Inf bucket. Struct padding. The C++ header grew to
32 bytes when writer_pid was added, while the Python exporter was still
unpacking three quadwords at 24 bytes, so every field read after the header was
misaligned garbage. The bucket-coverage panel showed it immediately. Any change
to a struct shared across the two languages has to be mirrored in the
exporter’s format string.
Latency numbers that were wrong but believable. Timestamps lived in shared
members and raced against the SPSC queue, and in one case a freshly computed
local was discarded in favour of a stale member when calling push(). The fix
was to carry the timestamps on OrderEntryItem itself, which is why
mRecvNS and mParseNS are public members of that class, and to capture the
apply timestamp on the consumer after the book is actually mutated rather than
on the producer after the enqueue. Nothing about the old numbers looked wrong
on the dashboard.
Throughput collapsed from 224 to 5 msg/s. A second dequeue() call ran
after the spin loop had already pulled an item, overwriting it and silently
discarding roughly 98% of messages. Nothing errored, no latency percentile
moved, and the books still updated. Only the throughput panel showed it.
The exporter unreachable on Linux but fine in Docker. firewalld filters
bare host processes on INPUT, while Docker-published ports bypass it via DNAT
through FORWARD, so a containerised service answers while a bare Python
process on the same port does not.
Source
The repository lives on a self-hosted Gitea instance and is not publicly accessible. A read-only snapshot synced at build time is browsable here:
The ring header and the Prometheus exporter live in a separate shared repository, alongside a registry file. The exporter is built to serve several feed handlers from one process on one port, distinguishing them by label rather than by port or metric name. That path has not been exercised against a second feed handler yet, so it is a design property rather than a tested one.
Happy to walk through the code in person, or share specific files on request.